


In 2025, monitoring and optimizing eCommerce performance isn’t optional; it’s survival. Tracking the right metrics and applying the right growth strategies is what separates thriving stores from struggling ones.
With the rise of omnichannel behavior and AI-powered shopping journeys, data offers the only real-time insight into what’s working and what’s not. Whether it’s your marketing funnel or checkout experience, performance metrics inform smarter decisions and prevent costly guesswork.

The earlier you catch a dip in performance, the faster you recover revenue. Let’s say your average order value (AOV) suddenly drops. With performance tracking, you can pinpoint whether it’s due to pricing, product mix, or an ineffective upsell strategy. This 2025 guide walks you through the KPIs, tools, and tactics that help scale your store effectively.
6 Must-Know KPIs to Monitor Your Online Store’s Health
Tracking the right KPIs is the foundation of strong eCommerce performance. Without clear benchmarks, it’s impossible to know whether your marketing, design, or pricing strategies are truly effective. Below are six essential metrics every online store should monitor closely, because what gets measured gets improved.
Conversion Rate (CR)
Conversion rate is the heartbeat of eCommerce performance. It tells you what percentage of your website visitors are completing a desired action, typically making a purchase. A low CR may signal friction in the user journey, poor targeting, or unclear value propositions.
How to Measure It & What’s a Good Benchmark
Your conversion rate is calculated by this simple formula:
(Total Transactions / Total Unique Visitors) x 100
For most eCommerce stores, a typical CR falls between 2% and 5%, depending on the industry, device type, and traffic source. Mobile tends to convert lower than desktop, while returning visitors generally show stronger performance.
Quick Tips to Improve Conversion Rate
- Streamline Checkout: Reduce form fields and friction points.
- Use Trust Signals: Add badges, reviews, and clear return policies.
- Optimize CTA Placement: Ensure your “Add to Cart” or “Buy Now” buttons are visible and compelling.
- Leverage Urgency: Countdown timers, limited stock alerts, and flash sales boost conversion.
- Improve Product Pages: Use high-quality images, videos, and persuasive descriptions.
Bounce Rate
The bounce rate of a site can be calculated by this formula:
(Single-Page Sessions / Total Sessions) × 100
Bounce rate measures the percentage of visitors who leave your site after viewing only one page. A high bounce rate often indicates that visitors aren’t finding what they need, or worse, they’re getting a poor user experience that drives them away before engaging further.
What It Tells You About User Experience
When users bounce quickly, it often means the landing page didn’t match their expectations, failed to load properly, or lacked a clear value proposition. This metric gives you an early signal of UX issues, content mismatch, or even misleading ad targeting.
Fixing Common Causes (e.g. speed, UX)
- Improve Page Speed: Compress images, leverage browser caching, and use faster hosting to reduce load times.
- Align Content With Intent: Make sure ad and SEO keywords match on-page content.
- Mobile Optimization: Ensure smooth, responsive mobile design with clear navigation.
- Use Engaging Above-the-Fold Content: Capture attention quickly with headlines, media, and CTAs.
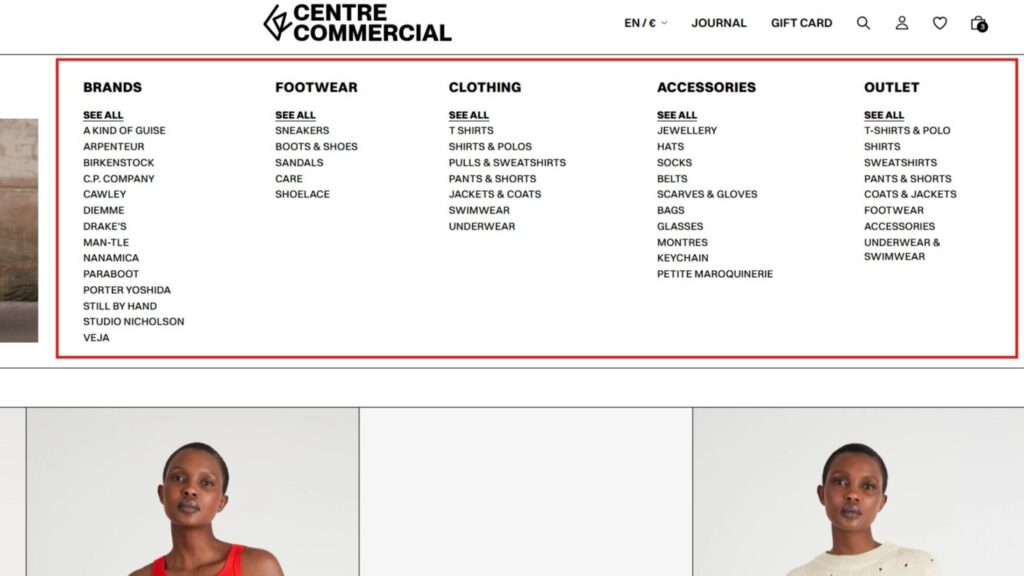
- Simplify Navigation: Make it easy for users to explore related products or services.
Average Order Value (AOV)
How to calculate the average order value of your products?
Total Revenue / Number of Orders
AOV tracks the average dollar amount spent each time a customer places an order. It’s one of the most direct levers to increase revenue without needing to drive more traffic. Improving AOV is about maximizing the value of every transaction through smart merchandising, upselling, and experience enhancements.
Cross-Sells, Upsells, and Bundling Techniques
- Cross-Selling: Suggest complementary items on product pages and in-cart (e.g., a phone case with a smartphone).
- Upselling: Offer higher-tier products or upgrades at the point of purchase.
- Product Bundling: Package multiple items together at a slight discount to increase perceived value and order size.
- Free Shipping Thresholds: Encourage customers to add more to their cart to qualify for free delivery.
- Time-Limited Offers: Use limited-time bundles or “complete the look” suggestions to encourage quick decision-making.

Customer Lifetime Value (CLV)
CLV is calculated by a more complicated formula:
Average Order Value × Purchase Frequency × Average Customer Lifespan
CLV represents the total revenue you can expect from a single customer throughout their relationship with your brand. It’s a long-term growth metric that emphasizes retention, loyalty, and repeat purchase behavior, key factors in sustainable eCommerce performance.
CLV vs AOV: Why Both Matter
While AOV looks at short-term transaction value, CLV gives you insight into long-term profitability. A customer with a high CLV might spend modestly per order but buy repeatedly over years. Ideally, you should work on increasing both: AOV boosts immediate revenue, and CLV maximizes total customer value over time.
Strategies to Extend CLV
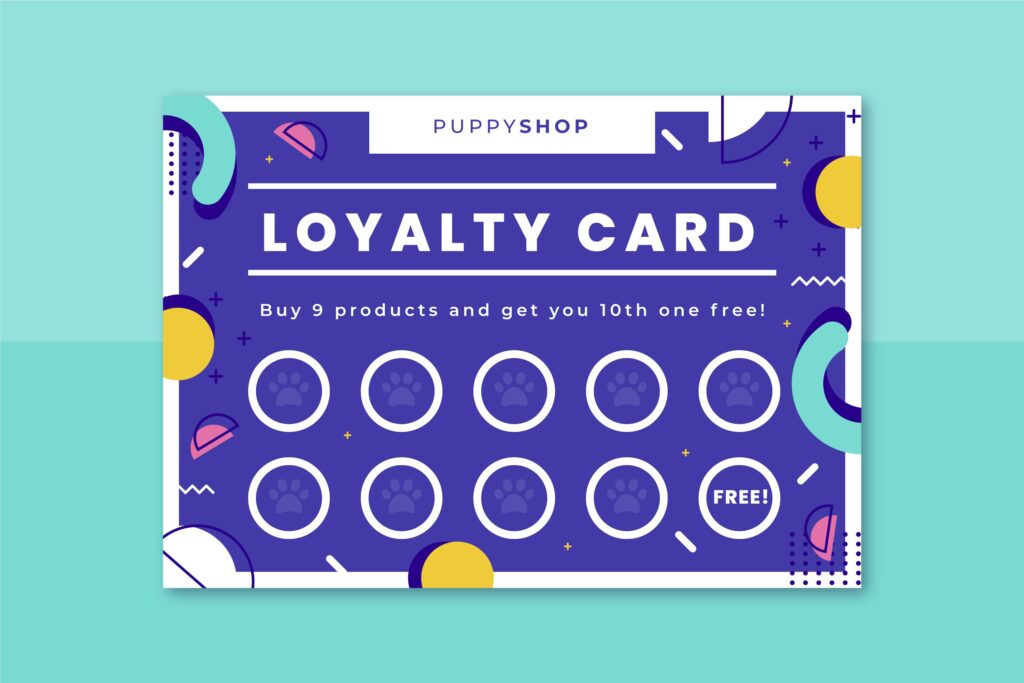
- Loyalty Programs: Reward points or tiered perks encourage repeat purchases and brand stickiness.
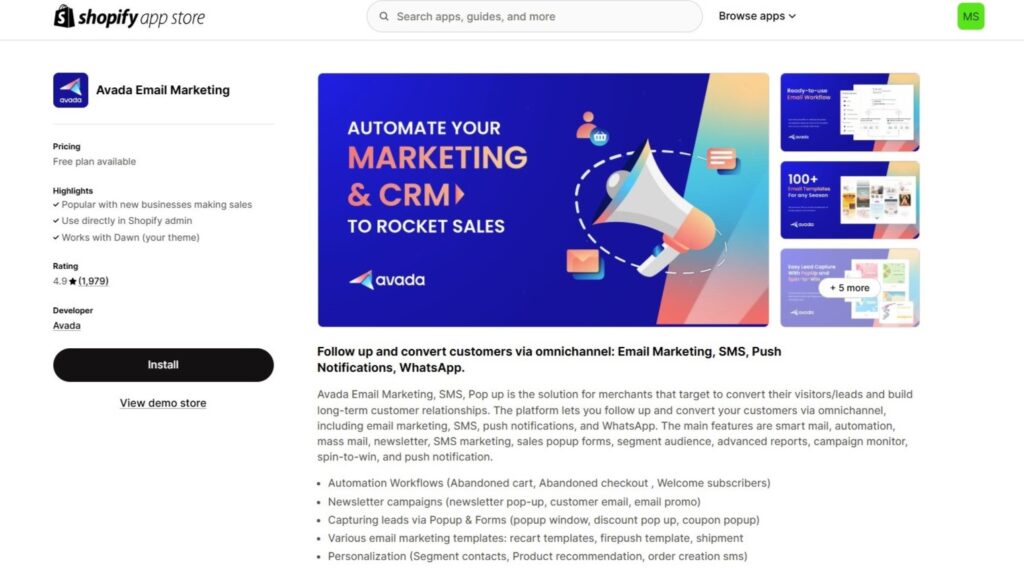
- Post-Purchase Email Flows: Follow up with personalized offers, product education, and reorder prompts.
- Subscription Models: Offer auto-refills or memberships to lock in recurring revenue.
- Customer Support Excellence: Quick, helpful responses increase satisfaction and lifetime loyalty.
- Community Building: Create exclusive communities or content access for long-term engagement.
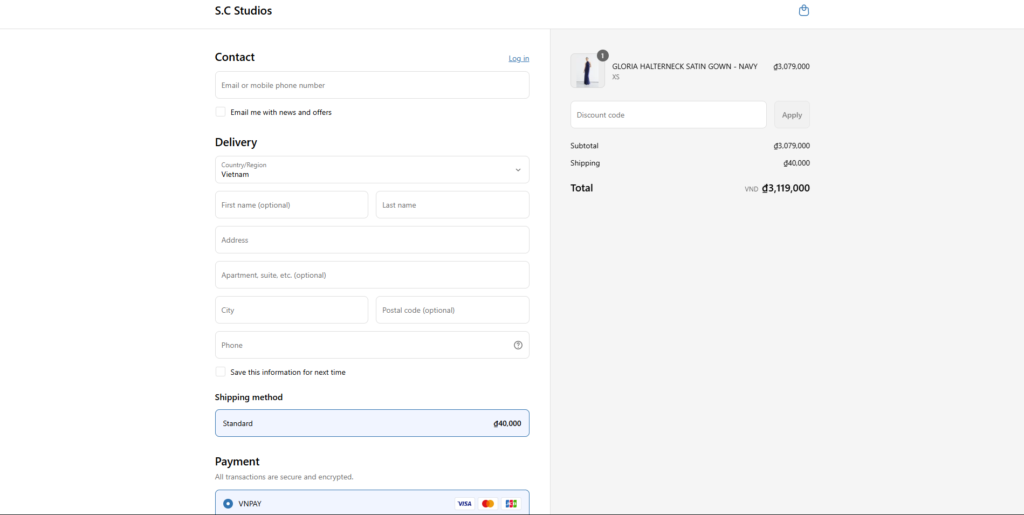
Cart Abandonment Rate
This measures the percentage of shoppers who add products to their cart but don’t complete the checkout.
[(Carts Created – Completed Purchases) / Carts Created] × 100
Cart abandonment is one of the most costly performance leaks in eCommerce. It occurs when a customer adds items to their cart but leaves the site before completing the purchase. The average cart abandonment rate sits around 70%, making this a critical KPI to monitor and improve.
Use Exit Popups, Email Recovery, and Incentives
- Exit-Intent Popups: Detect when users are about to leave the site and present them with a last-minute offer.
- Email Recovery Sequences: Trigger automated abandoned cart emails within 1–24 hours of abandonment to recapture interest.
- Incentives to Return: Offer limited-time discounts, free shipping, or bundle deals to encourage users to complete their checkout.
- On-Site Retargeting: Use dynamic banners or slide-ins when users return to remind them of what they left behind.

Repeat Purchase Rate
How to know if your retention strategy is working?
(Number of Returning Customers / Total Customers) × 100
Repeat purchase rate reflects how often customers come back to buy again, a key signal of loyalty and customer satisfaction. It helps gauge the effectiveness of your post-purchase experience and the overall stickiness of your brand.
Subscription Models and Loyalty Tactics
- Subscription Offers: Enable recurring orders for consumables or essentials with subscribe-and-save discounts.
- Point-Based Loyalty Programs: Reward customers for every purchase, review, or referral.
- Personalized Retargeting: Use behavior-based emails or ads to bring back previous buyers with relevant recommendations.
- Surprise & Delight Campaigns: Offer exclusive perks, gifts, or early access to loyal shoppers.
- Reorder Reminders: Automate reorder prompts based on product lifecycle and buying patterns.
Tools That Help You Track What Matters (GA4, Hotjar, etc.)
From GA4 to heatmaps and attribution dashboards, eCommerce businesses now have powerful tools to understand exactly what’s happening at every step of the customer journey. When used together, these tools provide a 360-degree view of user behavior, enabling smarter decisions and continuous performance optimization.
Setting Up Google Analytics 4 for eCommerce
Google Analytics 4 (GA4) is more than just a successor to Universal Analytics. Now it’s a comprehensive reimagining of how we collect and interpret web data. GA4 is built on an event-based data model, which is especially powerful for eCommerce tracking. Unlike sessions, events offer granular insight into every action a user takes on your site.
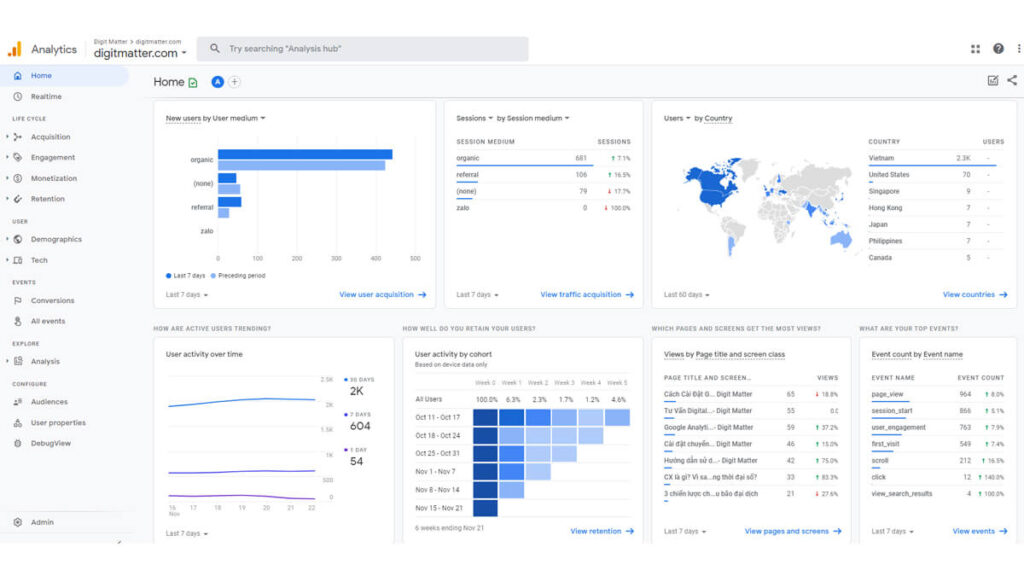
Key GA4 Events for Online Stores
To track eCommerce performance effectively, enable the following GA4 events:
- view_item: when a user views a product
- add_to_cart: when a product is added to cart
- begin_checkout: when the checkout process starts
- purchase: when a transaction is completed
These events allow you to monitor your sales funnel and diagnose where drop-offs occur in real time.
Pro Tip: Implement event tracking using Google Tag Manager for flexibility and minimal dev involvement.
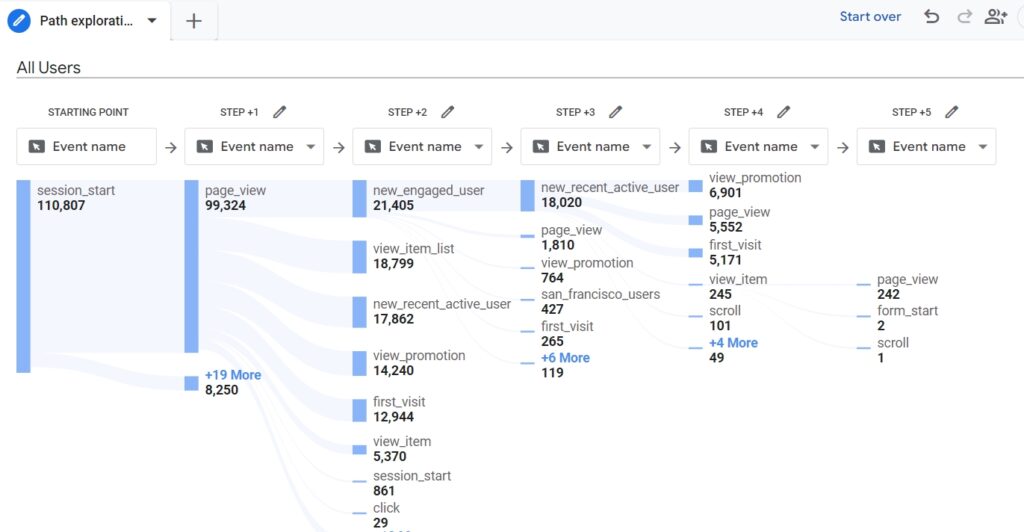
Ecommerce Funnel Tracking in GA4
Funnel exploration in GA4 lets you build step-by-step user journeys and visualize performance bottlenecks. You can segment these funnels by:
- Traffic source (ads, email, organic)
- Device type (mobile vs desktop)
- Geography or user behavior (new vs returning users)
This helps you answer critical questions like: “Are mobile users dropping off during checkout?” or “Which campaigns lead to full-funnel conversions?”
Pro Tip: Combine funnel insights with GA4’s predictive metrics (e.g., purchase probability) to trigger automated remarketing flows.
Use GA4’s Path Exploration or Funnel Exploration features to identify where customers are exiting your flow. It lets you segment by device, campaign, or product category to pinpoint exact issues.
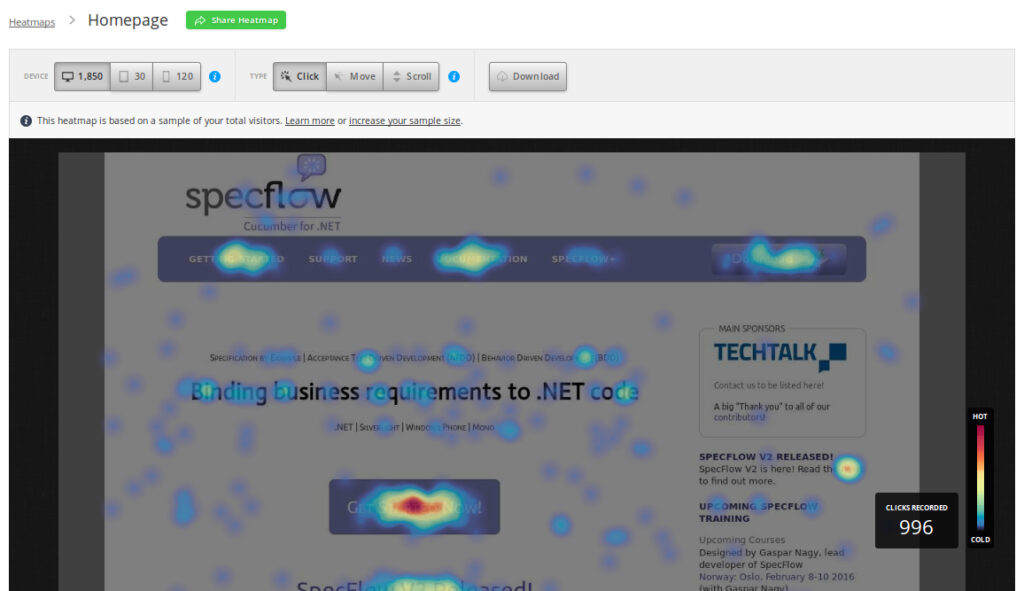
Heatmaps and Session Recording Tools
Quantitative metrics tell you what users are doing—heatmaps and session recordings tell you why. Tools like Hotjar, Crazy Egg, and Microsoft Clarity provide visual feedback on how users interact with your site.
These platforms generate visual maps of user interaction, including:
- Click Maps: showing the most-clicked elements
- Scroll Maps: indicating how far users scroll
- Move Maps: highlighting cursor paths and activity
Session recordings go deeper, allowing you to replay actual user sessions to see pain points, hesitations, and drop-offs.
These tools generate visual heatmaps for each page, helping identify ignored CTAs, confusing layout elements, or missed conversion opportunities. Use session recordings filtered by rage clicks, dead clicks, or quick exits to discover where users feel frustrated or confused.
Identifying UX Friction Points
Keep in mind to look for:
- Rage clicks (multiple rapid clicks in frustration)
- Cursor zig-zagging (indicates hesitation or confusion)
- Scroll depth drop-offs (users aren’t reaching CTAs or critical info)
Use this data to refine layout, simplify navigation, or reposition critical elements for better engagement.
Pro Tip: Compare session recordings for mobile vs. desktop users to uncover platform-specific UX challenges and opportunities.
Attribution Tools and Analytics Dashboards
Understanding where your sales are coming from is essential to improving eCommerce performance. Attribution tools and dashboards allow you to evaluate marketing ROI, eliminate underperforming campaigns, and optimize your spend across multiple channels. The goal is simple: make smarter decisions by knowing which touchpoints actually lead to conversions.
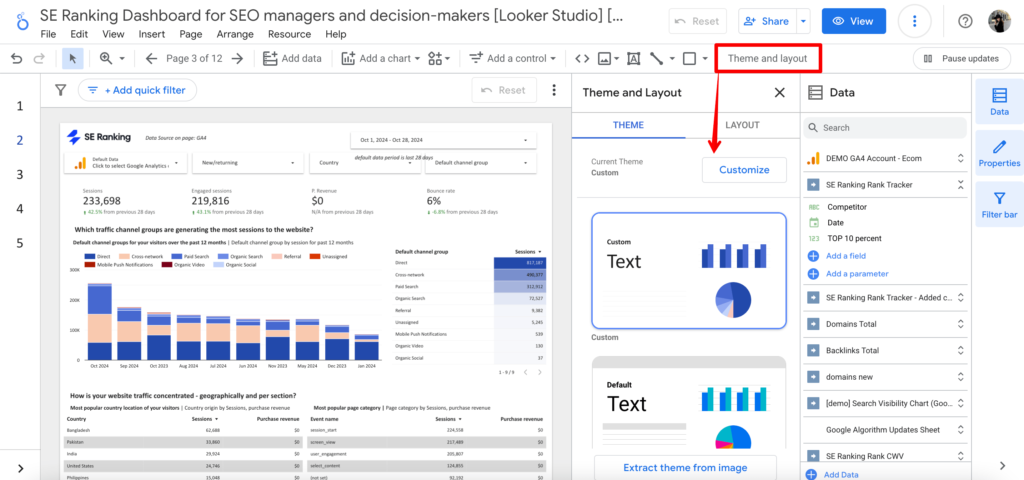
Using Looker Studio or Supermetrics for Reporting
Looker Studio and Supermetrics are powerful when combined. Supermetrics pulls marketing and sales data from multiple platforms (Google Analytics, Shopify, Meta, Klaviyo), while Looker Studio turns that data into clear, interactive dashboards.
- Centralized Visibility: View traffic, sales, and campaign performance in one place.
- Custom Dashboards: Tailor reports for specific audiences (executives vs marketing teams).
- Real-Time Monitoring: Track performance daily, weekly, or monthly to stay proactive.
Multi-Touch Attribution for Omnichannel Brands
Most eCommerce businesses rely on more than one marketing channel. Multi-touch attribution ensures each channel (email, paid search, social media) gets credit for its role in the buyer journey.
- Attribution Models: Use linear, time decay, or position-based models to reflect how users interact across multiple touchpoints.
- First-Party Data & UTM Tags: Use custom UTMs and internal tracking tools to maintain accurate data across platforms.
- Platform Tools: Leverage tools like Triple Whale, Northbeam, or Segment for more advanced attribution blending.
Pro Tip: Review attribution by cohort—first-time buyers may convert faster from ads, while returning customers might respond to email or SMS campaigns.
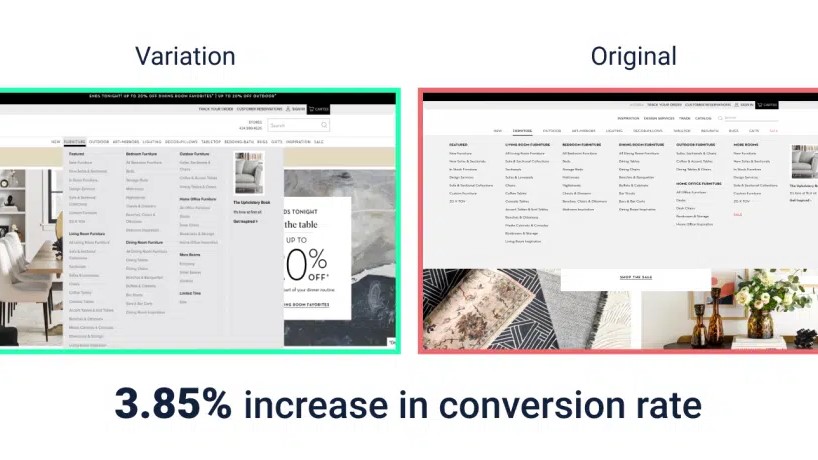
How to Use A/B Testing to Optimize Performance
A/B testing is one of the most effective methods for improving eCommerce performance without overhauling your entire site. By running controlled experiments with variations of headlines, product layouts, or CTAs, you gain measurable insights into what truly drives conversions. The key is structured execution and disciplined analysis.
A/B Testing Fundamentals for eCommerce
When setting up tests, start with high-impact elements:
- Call-to-Action (CTA): Text, color, placement, and button shape.
- Page Layout: Navigation menus, product detail page arrangements, or mobile flow order.
- Images: Product thumbnails vs lifestyle visuals, image size, and carousels.
- Pricing Displays: Discounts vs regular price, urgency badges, and strikethrough pricing.
- Trust Signals: Positioning of reviews, badges, and guarantees.
Running an A/B Test Properly
A/B tests should not be performed based on gut feelings. To ensure a successful test, remember these rules:
- Sample Size: Use a calculator to ensure you reach statistical significance (typically 95% confidence level).
- Timing: Avoid testing during holiday seasons or abnormal traffic periods unless it’s part of the test context.
- Split Logic: Ensure visitors are randomly and evenly divided into control and variation groups.
Pro Tip: Test on a single device type first (e.g., mobile) if most traffic comes from there, then scale tests cross-platform.
Best Tools to Use
- VWO (Visual Website Optimizer): Great for both beginners and advanced users. Supports visual edits, goal setting, and heatmaps.
- Optimizely: Enterprise-grade testing with powerful personalization and multivariate testing.
- Convert.com: Privacy-compliant A/B testing platform with advanced targeting options.
- Google Optimize (Deprecated): Once a popular free option, look for VWO or Convert as alternatives.
Pro Tip: Choose a platform that integrates with your analytics stack (GA4, Shopify, Klaviyo) for seamless performance analysis.
Wrapping Up
Tracking KPIs, running A/B tests, and leveraging the right tools aren’t just checkboxes but your competitive edge in 2025. As markets evolve, only the stores that continually measure and improve will grow and thrive.
Let Wgentech help you take the guesswork out of performance. Whether you’re starting your online journey or scaling to the next level, we offer full-stack eCommerce Development Services and High-impact Website Optimization Solutions. Explore our eCommerce solutions now!