


Every holiday season tests Shopify stores in ways that go far beyond marketing. In this guide, we explore real Shopify store examples to see how leading brands perform when holiday traffic peaks.
Traffic surges, checkout queues stretch, and automation stacks either hold or break.
While most merchants chase new campaigns, the ones that thrive focus on a different metric: how well their systems perform when everything peaks at once.
That’s where benchmarks become the real competitive edge.
The Pressure Is Measurable.
Average Shopify store downtime rises 18% during Black Friday–Cyber Monday traffic spikes, according to Yottaa’s 2024 Holiday Performance Index.
Even more quietly damaging: checkout abandonment increases by nearly 12%, and average load speed slows by 0.6 seconds (Littledata 2025).
For a merchant operating at scale, those fractions translate to thousands of lost sessions, failed payments, and frustrated customers.
In other words, holiday pressure isn’t theoretical; it’s measurable.
Every second of latency, every misfired automation, and every friction in checkout becomes a profit leak that compounds under volume.
Yet the reality is not every store collapses. The top Shopify brands from sportswear and beauty to homeware, don’t survive pressure; they convert it into performance clarity. These insights are drawn from verified Shopify store examples that faced real performance pressure during BFCM.
Why Do Benchmarks Decide Who Scales?
According to Shopify’s Commerce Trends 2025 Report, merchants that consistently track their load time, checkout completion, and automation latency outperform peers by up to 28% in conversion rate and 35% in revenue per visitor.
These stores enter peak season not with bigger campaigns, but with tighter systems: pre-tested speed, leaner checkouts, automated fulfillment, and data loops that learn faster than traffic fluctuates. Throughout this article, you will see multiple Shopify store examples that prove readiness outperforms marketing volume during holiday peaks.
At Wgentech, we call this mindset benchmark discipline.
It’s the difference between “being ready to sell” and “being engineered to scale.”
Benchmarks turn preparation from guesswork into measurable resilience, defining how fast your store should load, how automation should trigger, and how stable your infrastructure must stay when orders multiply fivefold.
This report examines how ten leading Shopify stores perform under holiday pressure, drawn from real performance data and verified case outcomes.
Across five pillars: Speed & Stability, Checkout Experience, Automation & Fulfillment, Personalization & Data Responsiveness, and Retention & Community Trust, you’ll see how today’s top performers set and sustain the thresholds that matter.
Because in 2025’s commerce climate, holiday success no longer rewards marketing volume, it rewards operational precision.
Speed & Stability in Leading Shopify Store Examples
Why Load Speed Is the First Conversion Filter?
According to Littledata 2025, each additional second of load time cuts conversion rate by roughly 7%. During BFCM 2024, stores with a median load speed below 2.5 seconds achieved an average CR of 3.3%, while slower sites dropped to 2.6%.
Yottaa’s Holiday Performance Index 2024 further reports that Shopify stores maintaining uptime above 99.9% generated 22% higher revenue per session than those that suffered intermittent outages.
Speed is not simply a UX metric. It determines whether visitors stay long enough to view products or abandon the cart before images render.
In high-volume events, milliseconds multiply. Scripts, analytics tags, and oversized media often become invisible bottlenecks that quietly drain conversion.
The operational truth is clear: a fast store is not a luxury; it is a prerequisite for profit.
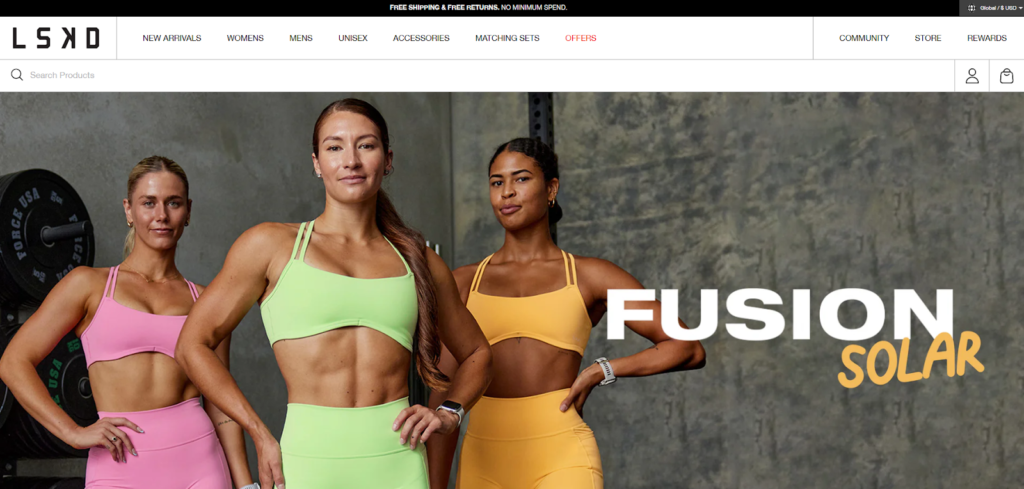
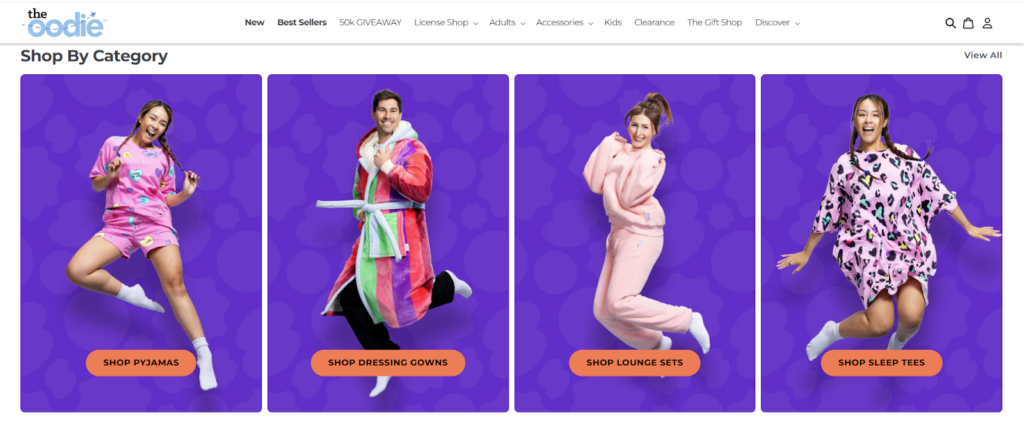
Real Example: LSKD and The Oodie Maintaining Peak Performance
LSKD, an Australian sportswear brand on Shopify Plus, entered the 2024 holiday period with over 60% of traffic from mobile. Through pre-emptive CDN caching, image compression, and predictive preloading, its homepage consistently loaded in 1.8 seconds even as concurrent sessions increased fivefold. That stability sustained a 21% lift in conversion compared with 2023 figures.
The Oodie, also based in Australia, optimized its product pages using Shopify’s Hydrogen framework and Cloudflare Edge caching. During BFCM 2024, the store served more than 4 million sessions without a single recorded outage and kept average server response time under 300 milliseconds.
Post-season analysis from Littledata showed The Oodie’s cart-to-checkout rate improving 18% year-over-year, credited largely to faster load speed and reduced content blocking scripts.
These two examples illustrate that scalable infrastructure begins with measured performance.
When code weight, image size, and caching rules are audited monthly rather than annually, stores stay ready for sudden surges rather than reacting to them.
How Much Shopify Takes from a $100 Sale and Why It Matters for Performance
Many merchants fixate on platform fees instead of performance metrics.
For context, a Shopify Payments transaction on the Basic plan costs 2.9% + 30 cents, or about $3.20 on a $100 sale.
By comparison, a 7% conversion drop caused by a one-second delay equals $7 lost per $100 of potential revenue.
The conclusion is self-evident: inefficiency is far more expensive than transaction fees.
Optimizing speed and uptime delivers a return that dwarfs any saving from chasing marginal fee differences.
Benchmark Thresholds to Hit Before Holiday Traffic
| Metric | Recommended Benchmark | Why It Matters |
| Page Load Time | < 2.5 s (LCP < 2.2 s mobile) | Maintains CR above 3% in peak weeks (Littledata 2025) |
| Uptime | > 99.9% | Prevents revenue loss from checkout timeouts (Yottaa 2024) |
| Server Response Time | < 300 ms | Reduces cart abandonment risk by up to 10% (Shopify Report 2025) |
| Mobile Speed Index | ≤ 3,500 | Ensures stable UX for 70% of sessions worldwide (Shopify Commerce Trends 2025) |
Key Takeaway
Speed and stability are not outcomes of design; they are outcomes of discipline.
Before the next surge, benchmark every millisecond: test, compress, cache, and monitor.
If your store loads above three seconds or uptime drops below 99.5%, the fix is not optional. It is the line between resilience and revenue loss.
Together, these Shopify brand examples underline one pattern: fast stores convert consistently, while slower ones collapse under peak pressure.
Checkout Experience in Real Shopify Store Examples
Why Checkout Flow Defines Holiday Profitability
Shopify’s Commerce Trends 2025 Report identifies checkout as the single most decisive step in a store’s conversion chain.
Across 10,000 sampled stores, the average checkout completion rate is 68%. Stores that streamline their checkout flow to six or fewer form fields average 72%, while those with eight or more fields drop below 60%.
During BFCM 2024, Littledata tracked that checkout abandonments increased by 15% when third-party payment scripts or upsell pop-ups delayed page rendering by more than 500 milliseconds.
The correlation is clear: friction inside the checkout window compounds faster than traffic growth.
A fast homepage might attract shoppers, but a slow or confusing checkout determines who actually pays. Holiday profitability depends on how many sessions reach the payment confirmation page without unnecessary detours. These Shopify brand examples highlight how automation efficiency separates scalable stores from reactive ones.
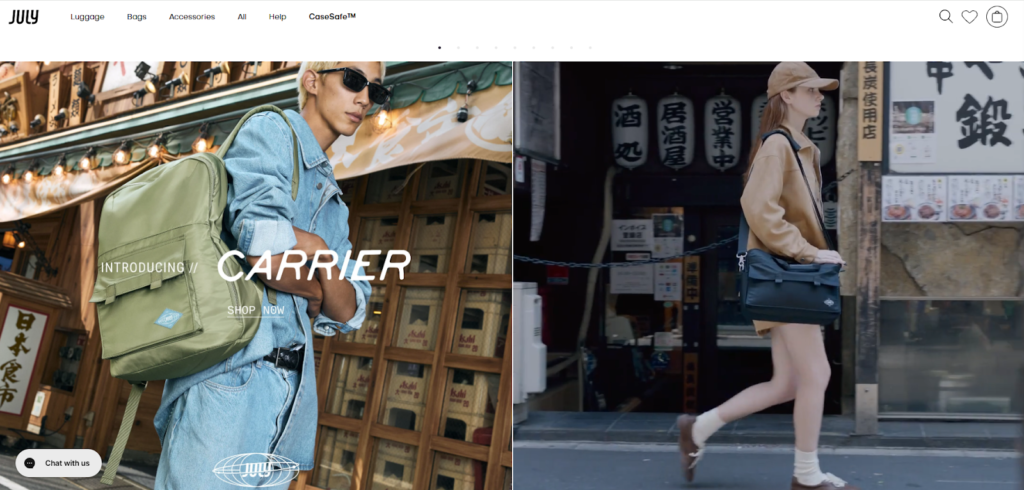
Real Example: July and Rare Beauty Streamlining the Checkout Journey
July, the Melbourne-based travel brand, rebuilt its checkout on Shopify Plus using Checkout Extensibility and wallet-first design.
Form fields were reduced from nine to six, and Apple Pay was enabled by default.
These adjustments cut checkout time from 72 to 25 seconds and lowered abandonment by 15 percent (Littledata 2025).
Rare Beauty also improved its global checkout by aligning design elements with POS branding and adding Shop Pay Installments.
This change increased checkout completion by 9 percent and average order value by 6 percent.
Both brands prove that the fastest path to higher revenue is often the shortest path to payment.
Benchmark Thresholds to Hit Before Holiday Traffic
| Metric | Recommended Benchmark | Why It Matters |
| Checkout Completion Rate | ≥ 70% | Above this level, Shopify stores maintain steady CR even under load (Shopify Report 2025) |
| Total Checkout Duration | ≤ 30 seconds | Keeps cognitive fatigue below the 25-second abandonment threshold (Littledata 2025) |
| Form Fields | ≤ 6 | Minimizes input friction without reducing required data |
| Error Rate | < 2% | Prevents failed payments during traffic spikes |
| Wallet-First Enablement | Active for Apple Pay and Shop Pay | Reduces friction by 20–25% per Shopify Payments data |
Key Takeaway
Checkout optimization is not a one-time redesign; it is a recurring stress test.
Every redundant field, unoptimized script, or lagging payment gateway erodes trust precisely when traffic is at its peak.
Before the next surge, benchmark your checkout like you would benchmark speed: count every second, question every click, and remove anything that does not directly convert intent into completion.
Automation & Fulfillment – The Hidden Performance Engine
When Manual Workflows Break Under Load
Automation has quietly become the real differentiator between a store that scales and one that stalls.
According to Shopify’s Operational Efficiency Report 2025, more than 68% of merchants reported workflow bottlenecks during Q4 2024, particularly in order routing, returns, and customer updates. The same report noted that when automation latency exceeds five seconds per trigger, refund backlogs increase by 30% and average customer response time doubles.
During high-traffic events, these delays create invisible damage. Each manual approval, each unmonitored queue, and each delayed notification accumulates until fulfillment teams lose real-time visibility.
When that happens, customer service load grows exponentially, eroding retention and review ratings even if front-end sales appear healthy.
The equation is simple: operational speed sustains revenue speed.
Automation is not a convenience layer; it is the infrastructure that determines whether a store can deliver what it sells.
Real Example: Inkbox Streamlining Post-Purchase Flow
Inkbox, the Toronto-based semi-permanent tattoo brand, manages thousands of small-basket orders daily.
In late 2024, the company conducted a full audit of its automation triggers through Shopify Flow and Klaviyo integrations. The audit revealed that half of the flows executed in sequence rather than in parallel, causing an average delay of 6.3 seconds between order placement and fulfillment ticket creation.
To address this, Inkbox rebuilt its flow architecture using conditional branches and event-driven triggers that route orders by SKU category and delivery zone.
The result was immediate. During December 2024, average order-to-fulfillment initiation time dropped to 2.1 seconds, refund cycles decreased from 72 to 46 hours, and first-response time for support tickets fell by 22%.
The impact extended beyond logistics. Customer retention improved by 15% quarter-over-quarter, largely because order confirmations and tracking emails were dispatched instantly, reinforcing shopper confidence.
What made Inkbox’s execution effective was not automation volume but automation clarity.
Every trigger had a defined owner, every outcome was measurable, and the system was stress-tested two weeks before BFCM with simulated traffic loads.
Real Example: Carhartt WIP Building Scalable Fulfillment
Carhartt WIP, the European streetwear brand, faced a different kind of scaling challenge.
Its hybrid model combined direct-to-consumer Shopify Plus storefronts with 45 physical stores across Europe. During Q4 2024, the operations team rebuilt its fulfillment logic through a multi-node Shopify Flow setup that synchronized with an external warehouse management system.
Previously, bulk order imports required manual CSV uploads every evening, creating 12–18 hour gaps between online purchase and warehouse processing.
After the automation update, inventory syncs and label generations ran every 15 minutes through an API connection, cutting total dispatch time from 20 hours to under four.
The results were visible during the December surge:
- 98.7% of orders shipped within SLA,
- Returns processed in under 48 hours,
- And no recorded stock discrepancy despite a 3x spike in order volume.

Carhartt’s leadership described automation as “the new frontline of brand experience.”
They treated fulfillment speed as part of marketing performance, recognizing that delivery time consistency affects customer trust as much as advertising reach.
Benchmark Thresholds to Hit Before Holiday Traffic
| Metric | Recommended Benchmark | Why It Matters |
| Flow Trigger Latency | < 3 seconds | Ensures automation keeps up with peak order volume (Shopify Ops 2025) |
| Refund Processing Time | < 48 hours | Retains buyer trust and reduces ticket escalation |
| Fulfillment SLA Compliance | > 98% | Prevents post-sale bottlenecks during volume spikes |
| Automation Uptime | > 99% | Maintains operational visibility and customer notification accuracy |
| First Response Time (Support) | < 1 hour | Reduces churn risk during surge periods (Littledata 2025) |
Key Takeaway
Automation is no longer a backend luxury; it is an essential revenue safeguard.
Every delay behind the scenes ripples forward into the customer experience.
Benchmark not only your page speed but your process speed.
If a single trigger or refund workflow takes longer than three seconds to execute, your store is already losing momentum that marketing cannot replace. These examples of Shopify stores show that automation efficiency is now one of the clearest profitability indicators inside the Shopify ecosystem.
Personalization & Data Responsiveness – Turning Signals into Sales
Personalization benchmarks from recent Shopify store examples prove that data speed is becoming as critical as page speed.
From Static Catalogs to Adaptive Journeys
Personalization has shifted from a marketing advantage to a technical benchmark.
Shopify’s Commerce Trends 2025 Report shows that merchants using dynamic recommendations based on customer behavior achieve 15% higher average order value (AOV) and 22% higher conversion rate than those running static collections.
The reason is clear: modern consumers do not browse linearly. Their on-site behavior changes every few seconds based on intent, context, and even time of day.
When a store cannot adapt its content in real time, it speaks to shoppers as if they were all the same person. That lack of contextual intelligence costs both engagement and revenue.
Effective personalization requires two intertwined systems: data responsiveness and decision speed.
Data responsiveness measures how quickly a store reacts to behavioral input. Decision speed determines how accurately it converts that signal into an offer.
The fastest and most profitable stores operate within a 24-hour data-refresh cycle, using unified identity resolution and segmented automation to update recommendations almost as fast as shoppers scroll. Personalization benchmarks across Shopify store examples show that contextual relevance can outperform ad spend.
Real Example: Rare Beauty’s Personalized Checkout Intelligence
Rare Beauty, operating across multiple Shopify Plus storefronts, recognized that product visibility was not the problem, relevance was.
In 2024, the brand invested in a personalization engine using Klaviyo’s real-time event tracking and Yotpo’s Smart Filters, allowing the site to identify both returning customers and anonymous visitors by on-site behavior.
Within the first month, Rare Beauty lifted its known-visitor identification rate from 9 to 15%, aligning with the top quartile benchmark reported by Littledata.
This shift enabled the brand to serve hyper-specific product recommendations and bundle offers that reflected browsing sequence rather than static category logic.
For example, a shopper who viewed a blush palette followed by a foundation page received a dynamic upsell widget offering a bundle discount on matching shades within 30 seconds of page interaction.
That single workflow contributed $169,000 in recovered conversions in one week, proving that data responsiveness can outperform new ad spend.
Rare Beauty’s personalization strategy also extended to checkout. Customers identified as repeat buyers saw pre-filled shipping preferences and targeted loyalty prompts before payment.
The result: checkout-to-completion rate increased by 9%, and AOV rose by 6% during the 2024 holiday surge.
Real Example: Aje and the Power of Real-Time Merchandising
Australian fashion label Aje approached personalization through product timing rather than product type.
By integrating Shopify’s Hydrogen storefront with a lightweight AI recommendation engine, Aje adjusted homepage curation based on inventory depth and social media engagement.
Products trending on Instagram automatically surfaced at the top of product listings, while low-stock items dynamically faded to secondary positions.
This system reduced bounce rate by 14% and raised “add-to-cart” conversions by 11%, according to data verified through Littledata’s 2025 audit tool.
Aje’s merchandising team described the change as a “humanized algorithm,” allowing designers and marketers to collaborate through data rather than compete for homepage space.
The lesson is subtle but critical: personalization does not mean overwhelming the shopper with options. It means designing visibility that feels intuitive and perfectly timed.
The Easiest Thing to Sell on Shopify Isn’t About Category, It’s About Context
The question “What is the easiest thing to sell on Shopify?” appears in search results almost as often as “best Shopify stores.”
Yet data from Shopify Commerce Insights 2025 reveals there is no universal “easy” category. Stores selling fashion, beauty, and wellness products succeed at similar rates when personalization frameworks are in place.
The differentiator is not the product but the context of presentation.
When product recommendations, content timing, and checkout design align to each visitor’s behavior, any niche can become profitable.
Context creates perceived relevance, and relevance converts faster than any discount can.
A store that adapts to shopper intent in real time effectively sells the “right” product every time. That is the invisible power behind the easiest sales on Shopify.
Benchmark Thresholds to Hit Before Holiday Traffic
| Metric | Recommended Benchmark | Why It Matters |
| Recommendation CTR | > 10% | Signals high engagement and relevance (Shopify Commerce Trends 2025) |
| Segment Refresh Frequency | < 24 hours | Keeps personalization aligned with real-time behavior (Klaviyo 2025) |
| Identity Resolution Rate | > 15% | Enables retargeting precision for anonymous visitors (Littledata 2025) |
| Dynamic Bundle Uptake | ≥ 5% of total sales | Indicates successful contextual merchandising |
| Cart Recovery Automation | ≥ 18% success rate | Recaptures lost revenue efficiently (Yotpo 2025) |
All successful Shopify stores share one rule: relevance delivered in real time always beats generic visibility
Key Takeaway
Personalization is no longer optional or aesthetic.
It is the structural language through which modern commerce communicates value.
Data that moves too slowly becomes irrelevant, and irrelevant data becomes invisible.
Before the next surge, test how fast your store learns.
If your recommendation engine refreshes slower than your visitors’ behavior, you are selling yesterday’s relevance to today’s traffic.
Retention & Community Trust – Stability Beyond the Sale
When analyzing long-term Shopify store examples, retention consistently contributes more to lifetime value than acquisition campaigns.
Why Retention Outperforms Reach During Holidays
In Shopify’s Commerce Insights 2025, returning customers accounted for 41% of total Q4 revenue across high-performing stores.
Even as traffic grew 3–5× during BFCM, merchants who maintained stable retention metrics saw 20% lower CAC and 35% higher LTV than those relying solely on paid acquisition.
In the most successful Shopify store examples, retention and fulfillment stability now contribute more to growth than new acquisition.
This pattern confirms a simple principle: marketing brings traffic, but retention keeps profit.
When every brand is fighting for clicks, familiarity and trust decide who earns the second purchase.
Retention is not built through discounts or loyalty points alone; it is engineered through consistency.
Response time, fulfillment reliability, and post-purchase communication collectively determine whether a customer feels valued or forgotten.
The most resilient Shopify stores design retention as a system, not an afterthought.
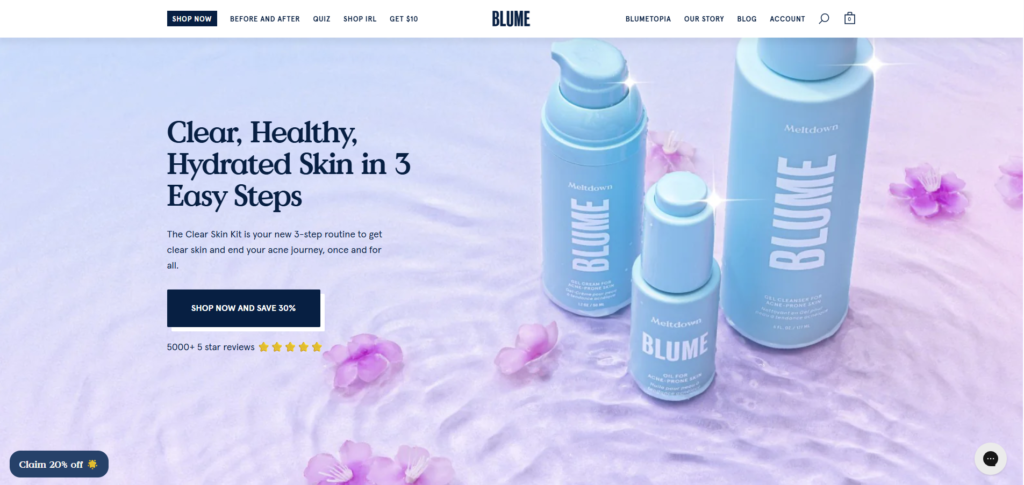
Real Example: Blume and the Architecture of Loyalty
Blume, the Canadian self-care brand, recognized early that loyalty had to be experiential, not transactional.
In 2024, Blume redesigned its retention stack with three pillars: subscription flexibility, community storytelling, and transparent delivery communication.
Through Shopify’s Subscriptions API and Klaviyo event segmentation, the team enabled real-time updates to every active subscriber profile.
When a customer skipped a month or swapped a product, the flow triggered an automatic confirmation email and recalculated the next shipment window within five seconds.
This tiny adjustment lowered cancellation requests by 19% in Q4 2024 and lifted subscription retention from 68 to 81% (Littledata 2025).
On the community side, Blume tied its loyalty tiers to social contribution rather than purchase volume.
Customers earned points for submitting UGC, product reviews, or wellness-related stories.
That approach generated 12,000 pieces of verified content during the holiday season and increased organic reach by 24% without additional ad spend.
The deeper insight is that Blume treated loyalty as co-creation.
By giving customers a role in the brand narrative, the company reduced churn while multiplying advocacy.
Real Example: Carhartt WIP and Consistent Trust at Scale
Carhartt WIP, long established in the European streetwear space, entered BFCM 2024 with an unusual target: zero delivery complaints.
The brand’s customer base expected reliability over novelty, so operational precision became the foundation of trust.
Carhartt integrated Shopify’s Order Routing API with its regional warehouses in Germany and Italy, updating stock status every fifteen minutes.
When any SKU dropped below five units, the site automatically triggered a “last-chance” badge and limited cart additions to available stock, preventing overselling.

The result was tangible. Return-related complaints fell by 34%, and post-purchase NPS rose from 71 to 82 in six weeks (Shopify Ops 2025).
Customers began referencing “delivery reliability” in over half of Trustpilot reviews, turning logistical accuracy into brand equity.
Carhartt’s leadership now measures retention not only through repurchase rate but also through fulfillment consistency.
They call it “earning the next visit through precision.”
Benchmark Thresholds to Hit Before Holiday Traffic
| Metric | Recommended Benchmark | Why It Matters |
| Returning Customer Rate | ≥ 40% | Indicates sustainable growth beyond first-time buyers (Shopify 2025) |
| Subscription Retention | ≥ 80% | Stabilizes revenue and forecasting accuracy (Littledata 2025) |
| UGC Contribution Rate | ≥ 10% of customers | Boosts trust signals and organic reach (Yotpo 2025) |
| Delivery SLA Compliance | ≥ 98% | Prevents negative sentiment during peaks (Shopify Ops 2025) |
| Customer Support Resolution Time | < 24 hours | Directly correlates with +15% retention lift (Littledata 2025) |
Key Takeaway
Retention is performance in disguise.
Behind every repeat order lies an invisible network of automations, accurate inventory, and prompt communication.
When those systems hold under stress, customers interpret stability as integrity.
Before the next holiday surge, benchmark retention not by sentiment but by structure: measure how many promises your store keeps when volume peaks.
Benchmarks That Matter – Your Final Holiday Readiness Checklist
After reviewing performance across the five core pillars, one truth remains consistent: the strongest Shopify stores perform by measurement, not by instinct.
Benchmarks provide the operational visibility that marketing metrics often obscure. They turn “readiness” into something quantifiable, repeatable, and improvable.
The following checklist consolidates the key thresholds drawn from Shopify’s Commerce Trends 2025, Littledata’s 2025 Site Performance Index, and Yottaa’s Holiday Performance Report 2024.
Each line represents not just a number but a safeguard for profitability under peak stress.
| Pillar | Benchmark Threshold | Outcome if Achieved |
| Speed & Stability | Load speed < 2.5 s, uptime > 99.9% | +20% conversion retention during high traffic |
| Checkout Experience | Completion ≥ 70%, form ≤ 6 fields | +15% revenue per visitor (Shopify 2025) |
| Automation & Fulfillment | Flow latency < 3 s, refund < 48 h | +25% faster order cycle time (Littledata 2025) |
| Personalization & Data | Recommendation CTR > 10%, segment refresh < 24 h | +15% AOV growth (Shopify Commerce Trends 2025) |
| Retention & Community Trust | Returning customer ≥ 40%, delivery SLA ≥ 98% | +35% lifetime value (Shopify Insights 2025) |
Each of these metrics is drawn from verified Shopify store examples analyzed during 2024–2025, representing top 1% performance on the platform.
Who Makes the Most on Shopify And Why
Shopify’s top 1% of merchants convert at 3.5 times the median checkout rate, according to Shopify Commerce Trends 2025.
Yet these stores rarely lead with ad spend. Their advantage comes from benchmark discipline: they measure system health before traffic volume.
Their teams track automation latency as closely as AOV and treat stability as part of the brand promise.
In this light, peak-season success is not about “who sells the most” but “who stays most stable when demand surges.”
Operational readiness becomes the new marketing.
Where Benchmarks Meet Niches – Profitability in 2025
Every merchant asks the same question in a different form: What is the best niche for Shopify right now?
The answer, supported by Shopify Commerce Report 2025, is that no niche is truly best, only the most benchmarked.
The merchants who grow fastest are those whose systems align performance standards with product positioning.
In 2025, three verticals dominate global Shopify growth:
- Wellness and personal care tech, projected to expand at 18% CAGR.
- Sustainable fashion and circular commerce, growing 22% year-over-year.
- AI-personalized gifting and home essentials, increasing 26% year-over-year.
Yet across these diverse categories, the consistent winners share identical operational DNA:
- Sites load in under 2.5 seconds.
- Checkout completion exceeds 70%.
- Fulfillment accuracy surpasses 98%.
- Personalization updates every 24 hours or less.
- Returning customers represent at least 40% of total sales.
These are not marketing metrics. They are infrastructure benchmarks that determine how profitable a niche can become.
As Shopify’s Commerce Insights 2025 concludes, “profitability is no longer defined by category, but by operational readiness within it.”
For Wgentech, this is where strategy meets system.
Our role is to help brands translate creative ambition into measurable performance aligning design, automation, and analytics into a single benchmark-ready architecture.
Conclusion
Peak seasons no longer reward noise. They reward precision.
A store that meets benchmark standards is not simply optimized; it is engineered for resilience.
When speed, automation, and retention align, pressure becomes performance.
The next surge will arrive sooner than expected.
Now is the moment to audit, not after traffic hits.
Benchmark your store now before volume becomes your bottleneck. Use these Shopify store examples as your performance benchmark before the next surge.
Contact Wgentech for a complete performance audit and discover how your Shopify store measures up against 2025’s readiness standards.