


When migrating from Universal Analytics (UA or GA3) to Google Analytics 4, it’s essential to compare the metrics of the two versions to gain insights and decide which one to choose for your merchant. It’s important to note that these two versions employ distinct data models and varied methods for calculating metrics. Consequently, the metrics will not align perfectly; some may exhibit slight differences, while others may vary significantly.
This post aims to provide a comparison of metrics in both versions to enhance understanding of these disparities.
A. Users
Universal Analytics comprises two User metrics, namely Total Users and New Users. In Google Analytics 4, the User metrics expand to three, encompassing Total Users, Active Users, and New Users. Total Users is a key metric in both UA and GA4, albeit with distinct definitions. In UA, Total Users represent the overall number of users, while in GA4, it specifically refers to the total count of unique users who have logged an event.
- Total User: overall number of users (UA) & total count of unique users who have logged an event (GA4)
- New Users: UA only tracked New Users on your website using cookie tracking methodology. Meanwhile, GA4 counts New Users across your website and app, hence the calculation involves counting the new unique user IDs that logged the first_open or first_visit event.
- Active Users: While UA does not have a specific metric for this, the number of distinct users who visited the website or application and engaged in a session defines Active Users in GA4. An active user is identified when Analytics collects:
- the first_visit event or engagement_time_msec parameter from a website
- the first_open event or engagement_time_msec parameter from an Android app
- the first_open or user_engagement event from an iOS app
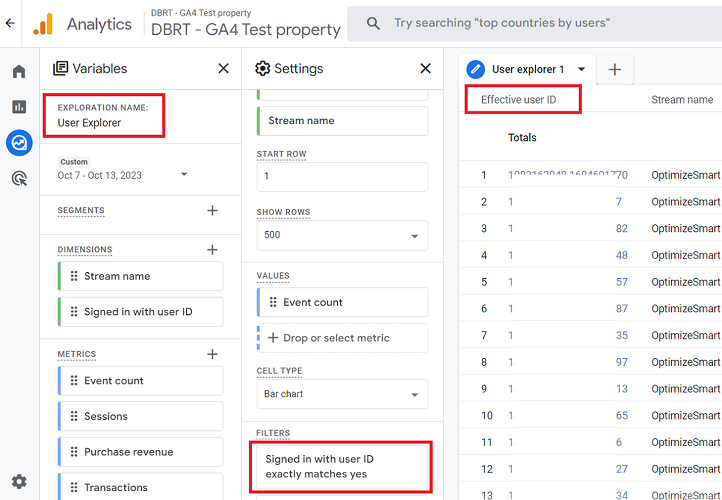
UA predominantly features Total Users (displayed as Users) in the majority of reports, while GA4 emphasizes Active Users (also labeled as Users). Differences may also arise from various settings between the two property types, such as distinct user-identity spaces; for instance, the GA 4 property might utilize User-ID, while the UA property could rely on Client-ID.
B. Pageviews
UA measures screen views separately for mobile-specific properties, whereas GA4 consolidates web and app data within a single property. Therefore, when evaluating pageview metrics between the two platforms, it is essential to consider the additional app traffic incorporated into GA4.
Both UA and GA4 allow the filtering of internal IP traffic and unwanted referrals, however, UA may have additional filters applied that can influence the data within the compared view that GA4 doesn’t possess. For instance, if filters are used in UA to exclude specific geographic regions, pageview counts may differ more when compared to GA4.
C. Purchases
In the realm of purchases, UA and GA4 exhibit both similarities and distinctions in their methodologies. In UA, purchase events are triggered within the Enhanced E-commerce model, and data is extracted from a product array using Google Analytics-provided JavaScript. GA4 also recommends the use of purchase events and follows a comparable data collection approach to UA. However, notable differences arise as GA4 does not furnish additional JavaScript for array collection. Instead, it expects users to provide the item array when gathering data for a purchase event, similar guidance is offered regarding populating a data layer object.
D. Session
In UA, when a user crosses midnight, a new session starts, contributing to potential discrepancies in session counts. In contrast, GA4 allows sessions to persist across midnight, leading to divergent session counts between the two platforms. If view filters are applied in UA, the session count may be affected, as some sessions might be filtered out. This discrepancy doesn’t arise in GA4, as it lacks the concept of view filters.
Furthermore, Google Analytics 4 properties utilize a statistical estimate for the number of sessions by estimating unique session IDs, introducing a level of approximation. In contrast, Universal Analytics properties do not employ such estimations when determining session counts.
The disparity in session counts between UA & GA4 can vary based on several factors unique to each business, such as:
- Total User: overall number of users (UA) & total count of unique users who have logged an event (GA4)
- New Users: UA only tracked New Users on your website using cookie tracking methodology. Meanwhile, GA4 counts New Users across your website and app, hence the calculation involves counting the new unique user IDs that logged the first_open or first_visit event.
- Active Users: While UA does not have a specific metric for this, the number of distinct users who visited the website or application and engaged in a session defines Active Users in GA4. An active user is identified when Analytics collects:
- the first_visit event or engagement_time_msec parameter from a website
- the first_open event or engagement_time_msec parameter from an Android app
- the first_open or user_engagement event from an iOS app
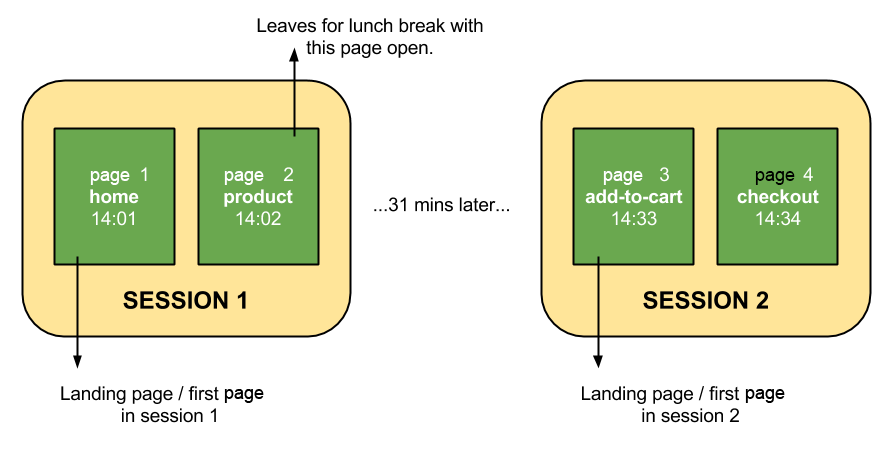
The example below shows how a web session is defined in UA:
Sam, a customer of the e-commerce website, discovers the site through an organic Google Search result. Upon clicking the result, he lands on the e-commerce platform’s homepage, proceeds to view products on the product page at 2:02 pm, and leaves the page open during his 31-minute lunch break. Upon returning, he resumes the purchasing process and completes the checkout. The following illustrates Sam’s user flow:
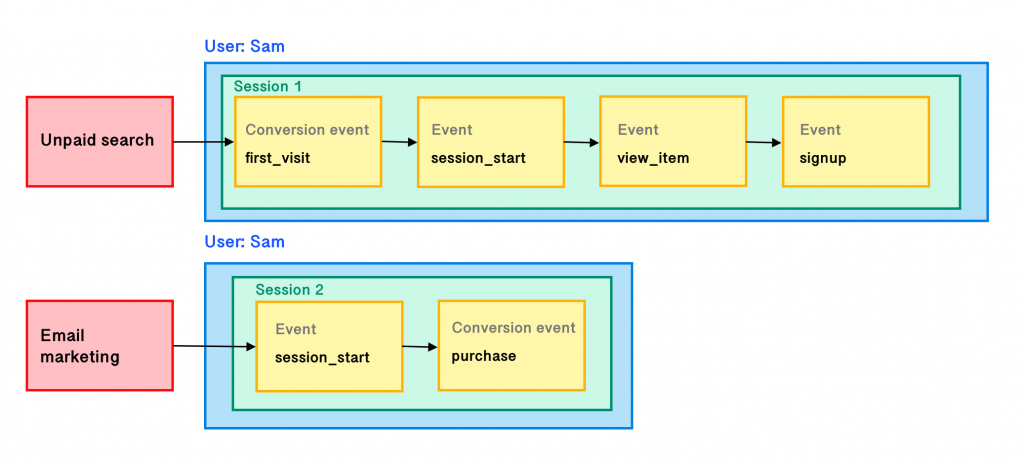
This is the GA4’s session example:
Sam, an e-commerce website customer, comes across the site via an organic Google Search result. After clicking the result, he arrives at the e-commerce platform, browses through various products, and eventually subscribes to the newsletter. Several days later, Sam engages with an email marketing campaign by clicking a link, revisits the website, and successfully finalizes a purchase. The following illustrates Sam’s user flow:
E. Session/Traffic-based acquisition metrics
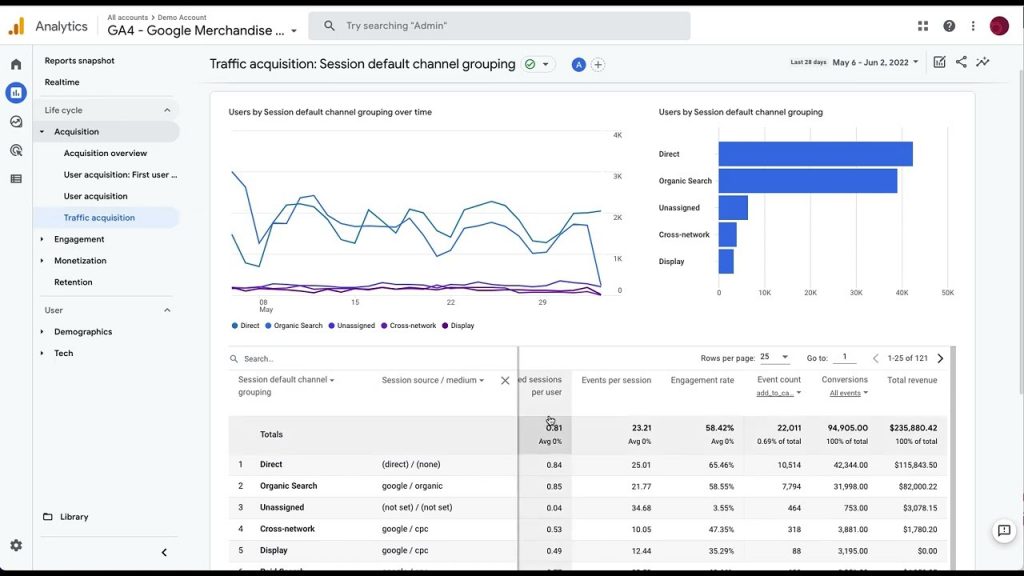
In UA, these metrics are located within the Acquisition section across various reports, including the Channels report and the Source/Medium report. The dimension being scrutinized against metrics such as Users and Sessions is typically either Channel or Source/Medium.
In GA4, the corresponding metrics are housed in the Traffic Acquisition report. The dimensions of Channel or Source/Medium are analyzed against metrics like Users and Sessions.
F. Conversions
A goal is defined to signify that a specific user action should be considered a conversion. For instance, when defining a “Form Submit” goal, a conversion is registered every time the form is submitted. UA counts only one conversion per session for each goal. Therefore, if the form is submitted twice during the same session, only one conversion will be counted for the “Form Submit” goal.
Conversely, GA4 allows for the specification of a conversion event for each desired action, such as designating the “Form Submit” event as a conversion event. In GA4, each instance of the conversion event is typically counted, even if the same event is recorded multiple times within a single session. This means that if a user submits the form twice during the same session, GA4 will count as two separate conversions for the specified “Form Submit” event.
G. Bounce rate
Bounce Rate in UA is described as the percentage of sessions on a website in which users viewed only one page and initiated a single request to the Analytics server. The visitor who views only one page is considered a bounce. The calculation for the bounce rate involves dividing the number of bounces by the total number of sessions.
Bounces/Sessions = Bounce Rate %
For instance, if two visitors view one page of the website and another visitor views two pages, the bounce rate would be approximately 63% (formula: 2(bounces)/3(total sessions) = 63.67%.
Bounce rate in Google Analytics 4 is calculated by dividing the count of bounces (non-engaged sessions) by the total number of sessions.
Bounces(non-engaged session)/Sessions x 100 = Bounce Rate %
For example, to calculate the bounce rate in 100 sessions which include 60 engaged with the website, identify non-engaged sessions by subtracting the engaged sessions from the total, resulting in 40 non-engaged sessions, commonly referred to as Bounces. Then, compute the bounce rate by dividing the number of Bounces (40 non-engaged sessions) by the total session count (100). Consequently, the bounce rate would be 40/100 x 100, leading to a 40% Bounce Rate.
(100-60)/100 x 100 = 40% Bounce Rate.
H. Event-Based Tracking
In Universal Analytics, the Total Events metric encompasses events characterized by a Category, Action, and Label, each constituting its distinct hit type. For instance, setting up an event to track a clicked sign-up button involves assigning a Category like “CTA,” an Action such as “Sign Up,” and a Label indicating the destination URL. The Total Events metric increments with each triggering of a Category/Action/Label event.
In contrast, Google Analytics 4 employs the Event count metric, where every “hit” qualifies as an event, regardless of Category, Action, or Label distinctions. For instance, viewing a website page triggers a page_view event. In GA4, all actions are considered events, and each event name may not necessarily be unique. Best practice in GA4 involves reusing the same event name and differentiating events by the values of parameters collected. For example, sign-up events might share the same name “sign_up” with different parameter setups like page_location, product, form_id, and others.
I. Conclusion
In conclusion, the exploration of metrics in Google Analytics 4 (GA4) versus Universal Analytics (UA or GA3) unveils nuanced differences in how these analytics platforms measure and interpret user data. From session tracking to event metrics, the distinctive methodologies employed by GA4 and GA3 underscore the evolving landscape of digital analytics. As businesses navigate the transition between these versions, a deeper understanding of these variations becomes paramount for making informed decisions and optimizing performance in an ever-evolving online environment.